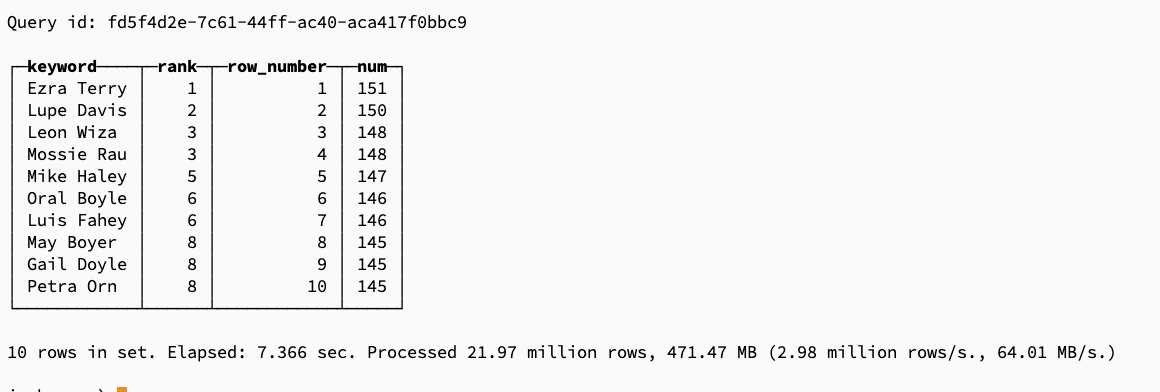
Grafana安装教程
温馨提示:
本文最后更新于 2022年06月07日,已超过 1,453 天没有更新。若文章内的图片失效(无法正常加载),请留言反馈或直接联系我。
Grafana下载解压
下载地址:https://grafana.com/grafana/download
之前都是自己下载二进制运行,这次换换口味,改成下载源,然后直接安装
//centos的
wget https://dl.grafana.com/enterprise/release/grafana-enterprise-8.5.4-1.x86_64.rpm
sudo yum install grafana-enterprise-8.5.4-1.x86_64.rpm
启动
systemctl start grafana-server
systemctl status grafana-server
输入 localhost:3000,即可看到grafana界面

登陆
默认账号密码为 admin/admin

配置prometheus
1:找到新增DataSource数据来源

2:选择prometheus

3:填写信息并保存

4:下载prometheus监控报表
下载地址:https://grafana.com/grafana/dashboards/
搜索node_exporter下载,也可以直接下载:https://grafana.com/api/dashboards/11074/revisions/1/download

导入grafana


导入成功,显示为:

正文到此结束
- 本文标签: 服务架构
- 本文链接: https://www.php20.cn/article/372
- 版权声明: 本文由仙士可原创发布,转载请遵循《署名-非商业性使用-相同方式共享 4.0 国际 (CC BY-NC-SA 4.0)》许可协议授权
热门推荐
相关文章
近期评论
-
来自: 留言板
-
来自: 如何策划一个模拟经营类的文字游戏
-
来自: 留言板
-
来自: 留言板
-
来自: 留言板
